How withHarmora works
The structure of the model, the data behind it, and a worked example you can check against a live report. Every figure traces back to a source named here.
The four layers
1 · Place — the base score
- Official data produces two grades: frequency and intensity. We combine them into a base score from 0–100, with frequency weighted more heavily than intensity.
- For bushfire, the inputs are the share of the postcode mapped as bushfire-prone and the composition of its vegetation categories.
- For heat, the inputs are the mean number of days at or above 35°C and the 1-in-200 hot day.
- Every score carries a data-confidence grade.
2 · Season — the seasonal factor
- We multiply the base score by a seasonal factor based on ENSO phase and strength, month, and climate zone. We check this factor monthly against the Bureau of Meteorology Climate Driver Update.
- The seasonal factor changes the ranking of risks. It does not create or remove a hazard.
- Flood protection rule: A factor below 1 does not lower a flood score unless a Bureau outlook confirms drier conditions. For 2026, El Niño is wetter in the east, so the flag is off and flood scores remain at the base score.
3 · Household — the vulnerability factors
- We ask 16 core questions, with follow-up questions only when the answers make them relevant.
- Each answer maps to a named factor with a fixed, capped adjustment. A factor applies only when it is relevant to the answer; we infer nothing beyond that.
- “Don't know” is available only for technical questions and questions about property history. In those cases, we use a postcode-level estimate and state that we have done so.
- Providing an address is optional. When you do, point-level signals replace postcode averages. We discard the address after the calculation and keep only the derived signals.
4 · Path — task selection
- Ranked risks lead to tasks drawn only from official guidance, with task counts kept as they appear in the source.
- The plan has four stages: First 72 hours; First week and beyond; Season maintenance; Skills and self-reliance.
- Within each stage, tasks are ordered by risk removed per dollar. Every task links to its official source.
Exact weights and caps are maintained internally for each model version. The structure, reasoning, sources and worked examples are the public record.
Scores rank your risks against each other. They are not probabilities and never a prediction.
Katoomba 2780: how the figures come together
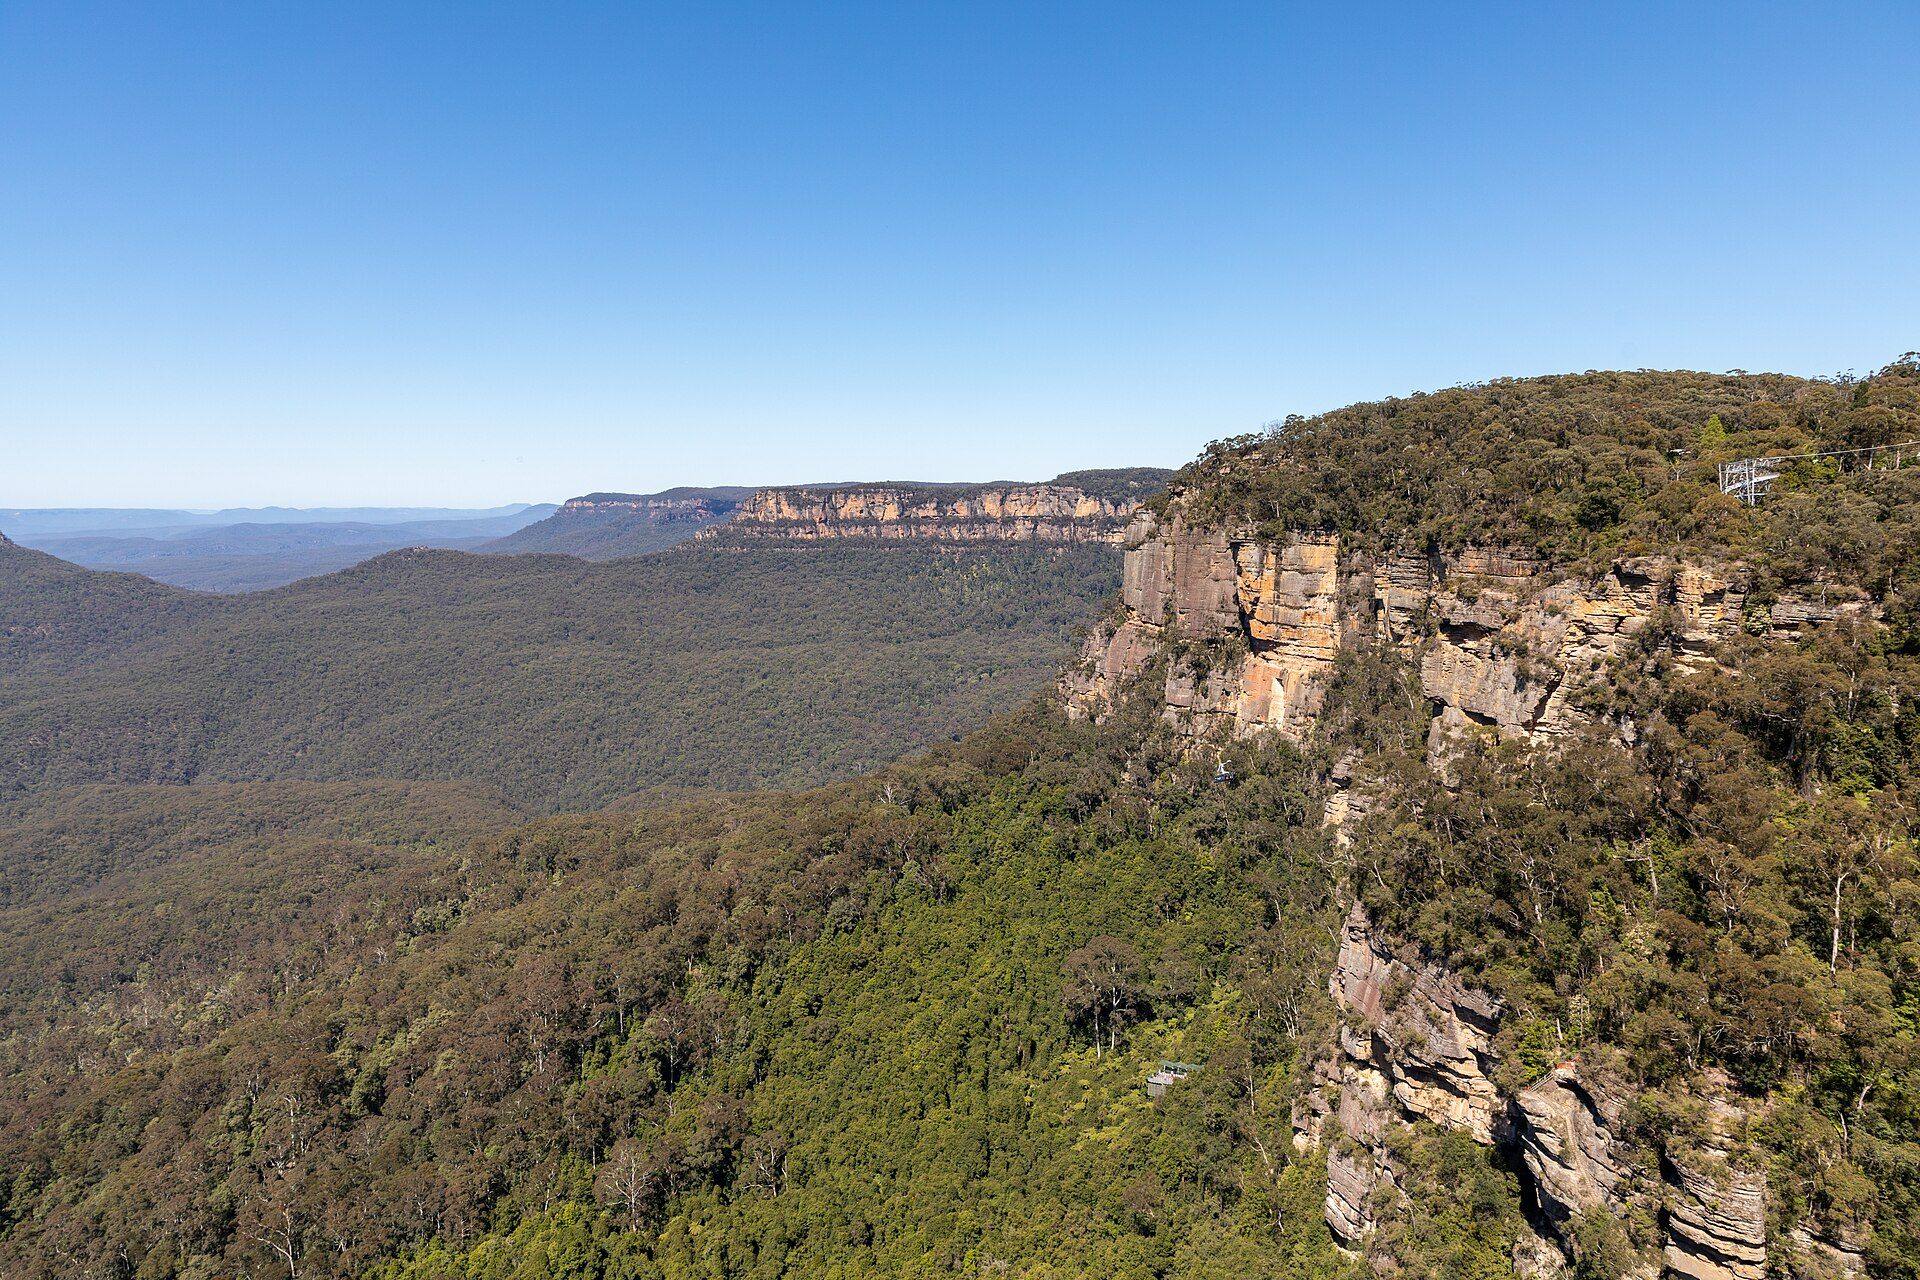
Bushfire mapping
Bushfire is in the highest frequency grade, with high intensity and high confidence.
Heat
Heat is a real risk here, but its score is low.
Seasonal adjustment
This summer, a strong El Niño lifts the bushfire score above its long-term base score. Under the flood protection rule, no flood figure is lowered.
The result
Bushfire is Katoomba's clear top risk, ranked #1.
Fire history
Fire history is shown, not scored. You can check these figures against the live 2780 report and the sources below.
Every score includes a confidence grade
Postcode-level or property-level official data.
Regional or partial official data.
Qualitative or state-level figures, for reference only.
Where no official data exists for a hazard in your postcode, withHarmora shows “data pending” instead of a score. Missing data is never treated as low risk.
Each of the 91 risks has a clear status
- Assessed — scored, with a named factor and reason.
- Gap measured — for reserves items, the gap is the amount you need minus what you hold. We show the shortfall itself.
- Capability rated — for evacuation items, the rating reflects whether your answers show that your household can actually carry out the task.
- Noted — recorded and explained, but not scored where no honest scale exists.
- Data pending — named, with no guessed score.
Some risks combine into named patterns. We show these only when at least two independent sources corroborate them.
When two risks compete, the report shows the original figure alongside the adjusted one. It never silently nets them off.
Your risk type comes from your leading risk and readiness
Every report names the household's risk type from a published set of 32. It is derived from the top risk family combined with a readiness index based on your answers.
Eight further types match only on rarer combinations of signals.
Types do not use demographics, and none is bought or assigned. Finish Stage 1 and the same household gets a new risk type one posture up.
The derivation rules are published on the types page.
Data sources and attribution
NSW RFS Bush Fire Prone Land CC BY
NSW bushfire-prone land, via NSW open data services.
NPWS Fire History, 1902–03 to 2026–27 CC BY 4.0
NSW fire history, via SEED. Planned burns do not count in the fire-history figures.
VIC Bushfire Prone Areas + Bushfire Management Overlay CC BY 4.0
Victorian bushfire mapping, via DataVic.
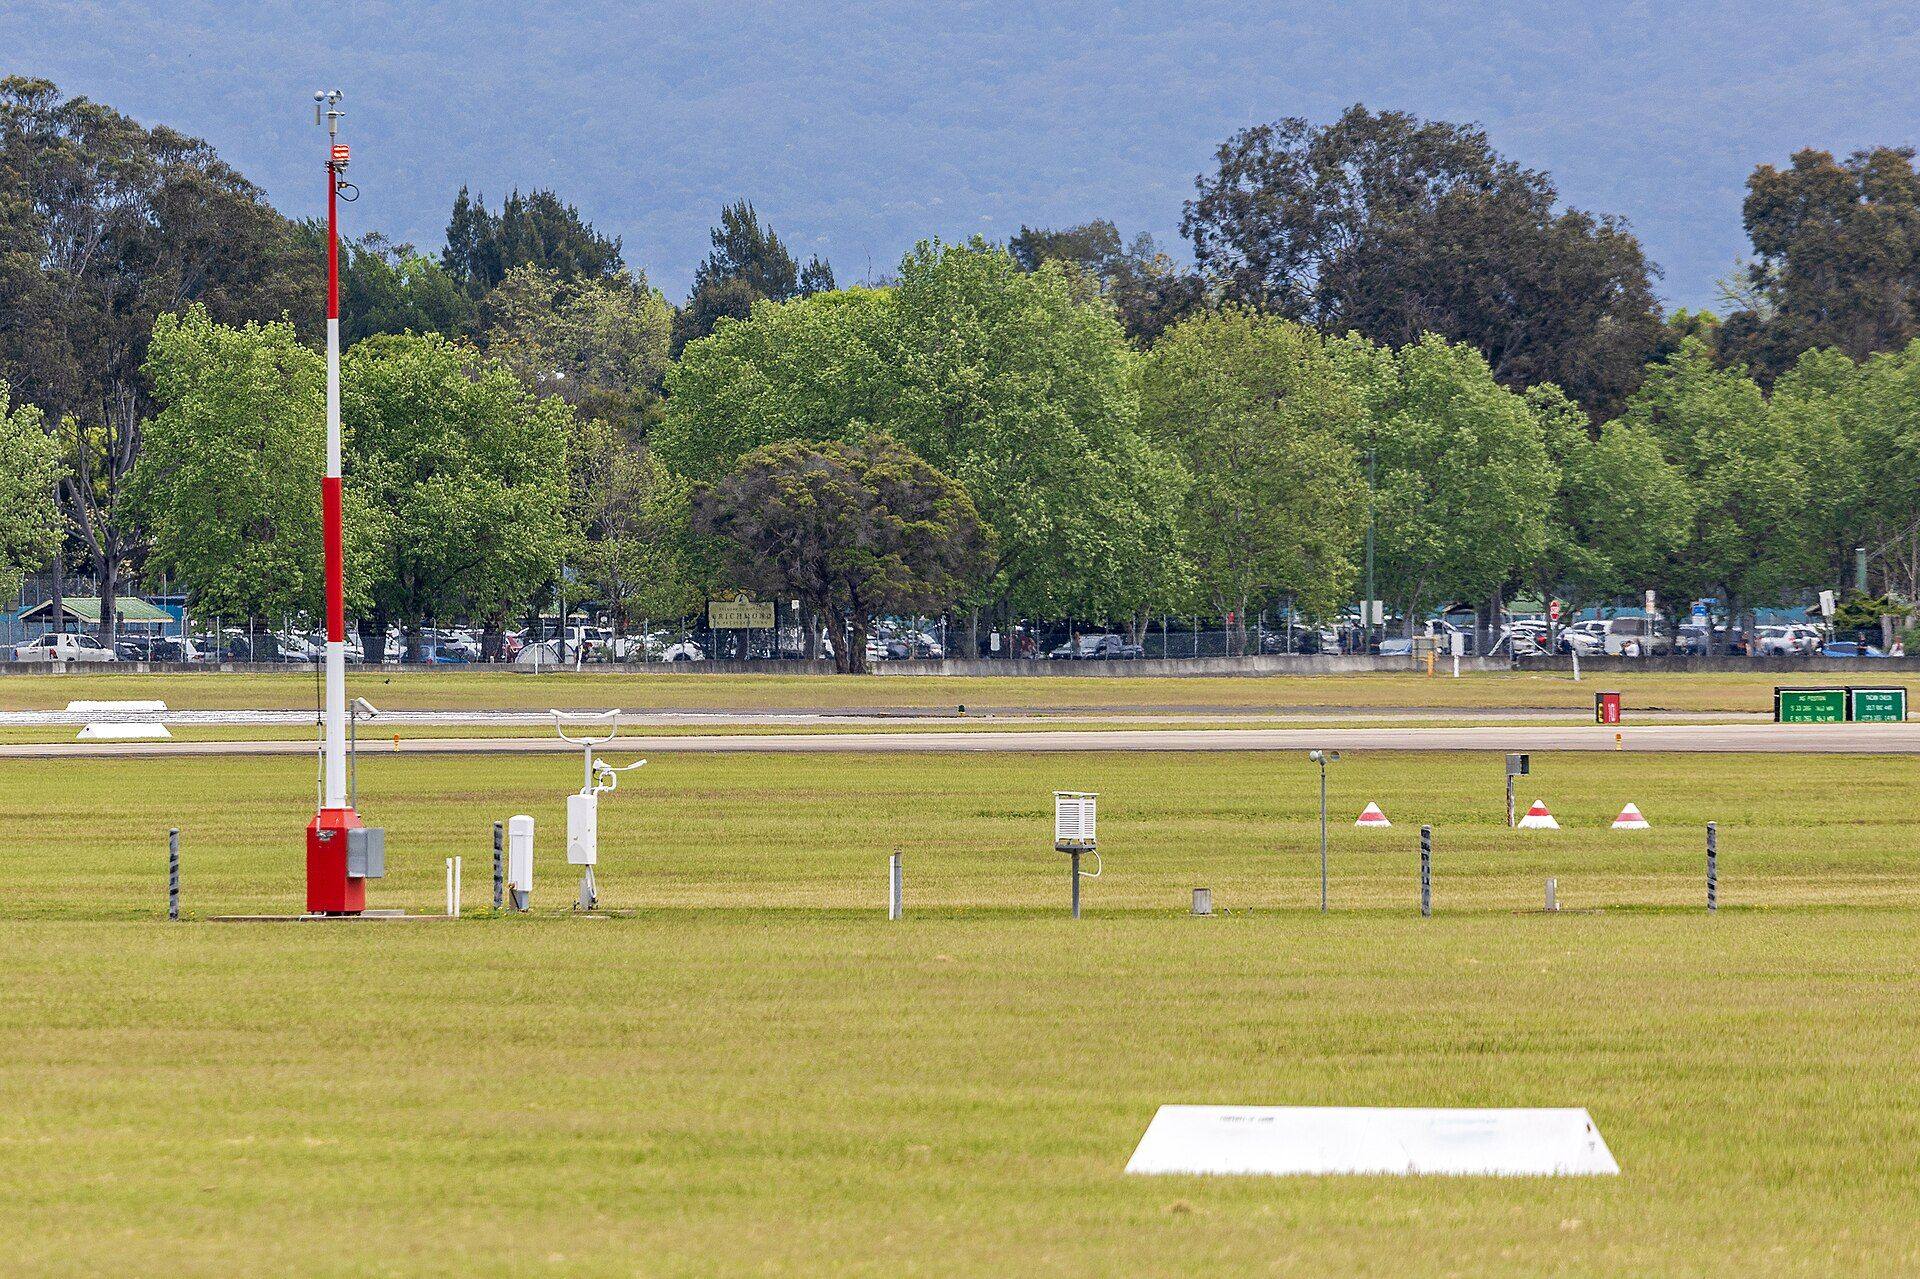
SILO gridded daily Tmax, ≈5 km grids, 2005–2024 CC BY 4.0
Extreme heat figures derived from Bureau observations. Temperature only, with no humidity, so humid heat is understated.
ABS, ASGS Edition 3
Postcode and suburb boundaries. ABS postcodes are a statistical approximation of Australia Post postcodes.
BoM outlooks + Climate Driver Update
Climate and seasonal outlooks, reviewed monthly. withHarmora does not republish BoM warnings. For live warnings, go directly to BoM and state services.
State services + Red Cross RediPlan
Preparedness guidance. Task counts follow the source. For example, 10 litres of drinking water per person for three days is a Queensland Government and Red Cross figure.
Real photography, credited where it appears
No generated disaster or people images. Copyright follows the image.
Land not mapped as bushfire-prone is not guaranteed safe from bushfire.
How we handle corrections
If a figure here turns out to be wrong, we fix it and note the correction here. Corrections are not quietly edited away.
The seasonal summary is reviewed monthly against the Bureau's Climate Driver Update.
Where coverage is available today
- 2,603 postcodes have real official bushfire mapping.
- 694 / 694 Victorian postcodes are covered.
- 612 / 612 NSW postcodes are covered. The ACT's 24 postcodes are now under standalone legislation.
- 16 postcodes are partly covered, with lower confidence stated in the report.
- Heat figures are real, with SILO grid climate data covering 2,604 postcodes.
- Bushfire mapping covers NSW, VIC, SA, WA, TAS, ACT and QLD, with 2,603 postcodes in total.
- The Northern Territory has no official bushfire-prone vector layer.
- Household-side groups — home, supplies and evacuation — are assessed everywhere from the answers.
- Beyond bushfire and heat, place-side items show data pending until the official layers are processed.
- Postcode climate zones are currently divided by state, pending a finer coastal/inland split.
Method, data and limitations in one place
The philosophy and thinking behind the model are explained on our About us page. This page covers the working details: method, data and limitations, written openly.
Questions about the method or sources?
Important information
withHarmora is an independent information service, not a government agency or emergency service. It has no affiliation with the Bureau of Meteorology, ABS, Australian Red Cross, or any state fire or emergency service.
The information here is not official advice and cannot replace official warnings. It is general in nature and based on the sources shown as at the date shown in the report.
Conditions change. Official warnings always take priority. Preparation never replaces leaving early when authorities advise evacuation.
In an emergency, call 000.